Task Failed Successfully: Saturating NIC and Disk Bandwidth
A journey from ‘wonder how’ to ‘wonder why’.
· 21 min read
0. “Task Failed Successfully” #
The AI era has arrived faster than most of us expected. Agentic coding has completely changed the way I work day to day. To be honest, I haven’t written a single line of code at work in quite a while. Yes, it is true. NOT A SINGLE LINE!! And yet, that hasn’t stopped the code from running across clusters with hundreds of HPC servers at peak performance.
Of course, not writing code (or even not fully reviewing it) does not mean we are just randomly poking around, like monkey typing. We still need to analyze requirements, refine the design with the agent, build demos, run mock experiments, study the results from small-scale tests, iterate on the problems we find, and maintain a complete, solid testing process, blah blah blah.

However, with AI and agentic coding, everything has become faster. Sometimes, code is churned out faster than we can fully understand it. And sometimes, it is even faster than AI can understand it. Yes, you read that right. And this post comes from one such example.
After I gave my agent the prompt to optimize the performance of my system, the AI quickly took it from roughly half throughput to full saturation. But its explanation of why it worked was completely wrong. It was a classic case of task failed successfully.

This post doesn’t talk about why the AI “failed successfully”. It is a walkthrough of the analysis and debugging process behind this system performance optimization.
1. Optimize a Demo with 1 NIC and 8 disks #
Let’s turn the system into a simple abstraction to focus on the performance optimization rather than the complex business:
A single thread issues 1 MiB random direct I/O reads across 8 NVMe drives, then sends the data to a remote host via RDMA WRITE. Now, saturate the NIC bandwidth.
More specifically, each drive can deliver up to 7 GiB/s of read throughput, and the NIC provides 400 Gb/s of network bandwidth. All devices are attached to the same NUMA node. The worker thread is pinned to a non-CPU0 core. The host runs with the IOMMU in passthrough mode, and none of the I/O devices involved are translated through the IOMMU.
For the implementation, I (actually it was my AI agent) built a very simple event loop: the client sends read requests to the server; the server polls the RDMA CQ for incoming requests, submits the reads through io_uring, polls for the resulting CQEs, and then sends the data back via RDMA WRITE.
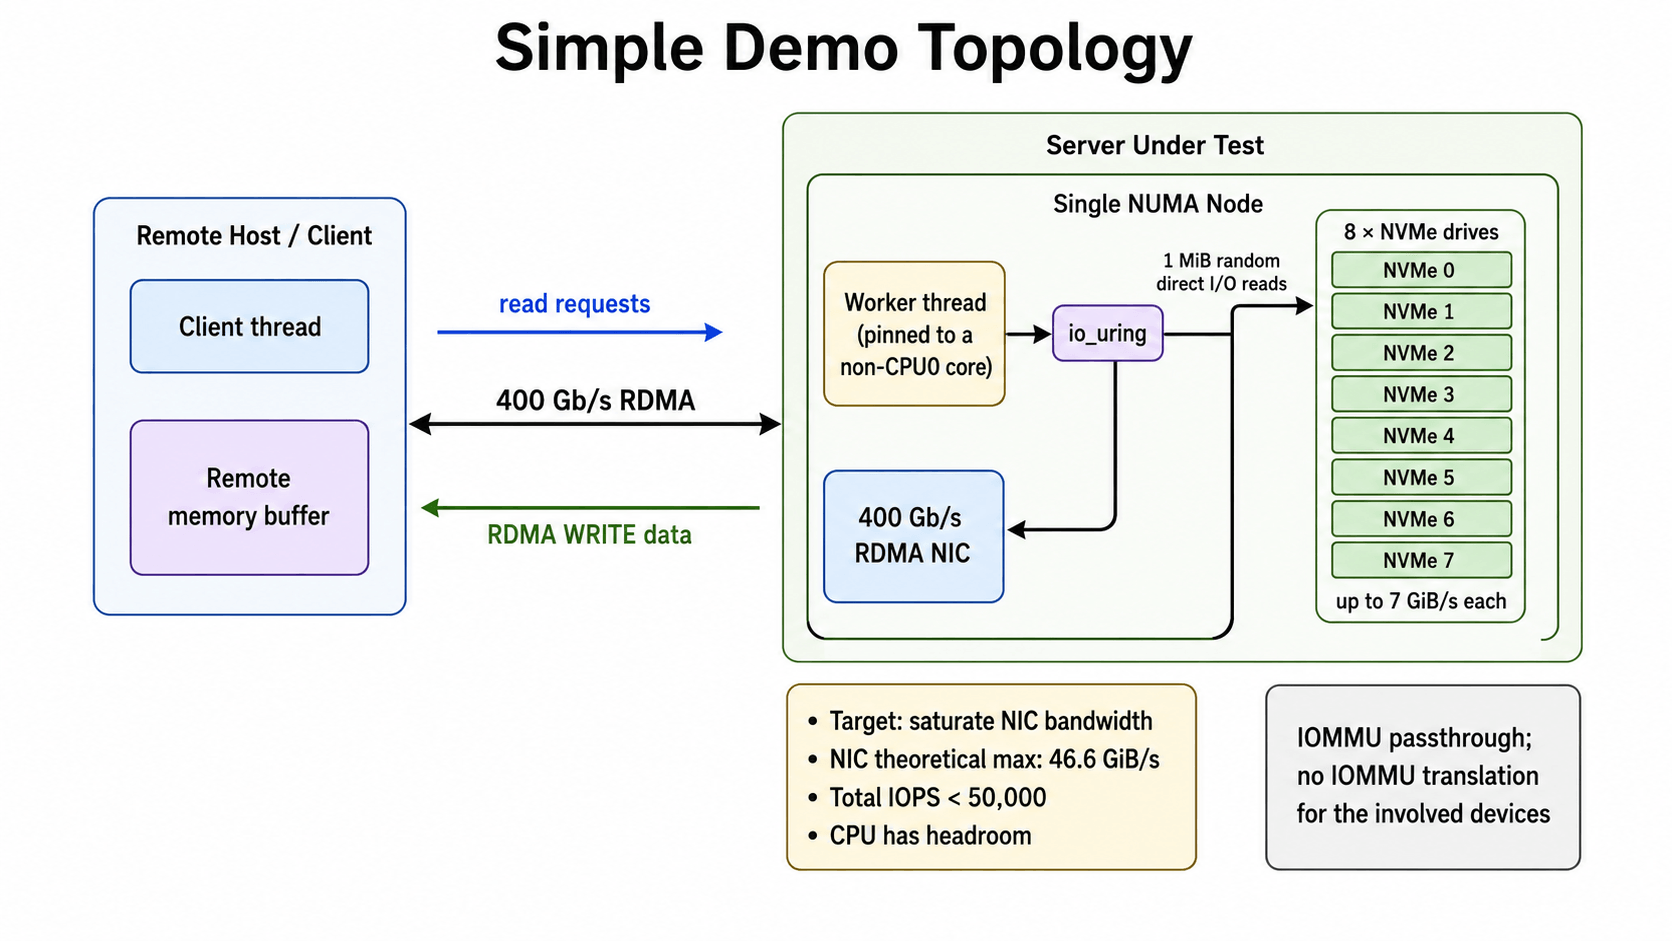
This demo setup is very straightforward and rules out almost all sources of interference. Other than the NIC we are trying to saturate, every component has plenty of headroom: the NIC’s theoretical maximum throughput is 46.6 GiB/s, each drive averages less than 6 GiB/s of read throughput, total IOPS stay below 50,000, and the CPU has more than enough capacity as well.
Now that everything is in place, let’s look at the results.
| inflight | GiB/s | avg µs | p50 µs | p90 µs | p99 µs | p99.9 µs |
|---|---|---|---|---|---|---|
| 4 | 8.87 | 440 | 430 | 519 | 632 | 759 |
| 8 | 15.56 | 501 | 486 | 616 | 784 | 955 |
| 16 | 22.69 | 688 | 670 | 850 | 1118 | 1436 |
| 32 | 22.53 | 1386 | 1384 | 1696 | 1934 | 2272 |
| 64 | 22.15 | 2821 | 2819 | 3133 | 3366 | 3691 |
Surprisingly, the system already hits a bottleneck at an I/O depth of just 16, with aggregate throughput reaching only about half of the NIC’s bandwidth. And the CPU utilization reached 100%.
It was clear that there must have been something wrong, so I profiled the system with perf at an I/O depth of 16. Here is the flamegraph.

As the flamegraph shows, most of the CPU time is spent in io_submit_sqes, which accounts for 81.62% of the total CPU cost. Because the demo uses Direct I/O, every I/O submission requires the kernel to construct DMA metadata from the user-space buffer for the block device to consume. The most costly parts of this path are:
__bio_iov_iter_get_pages: Turniovintobiopages.pin_user_pages_fast: Translates a user-space virtual address range into an array ofstruct pagepointers, and pins those pages so they cannot be reclaimed, migrated, or swapped out while the device is performing DMA.
bio_set_pages_dirty: Mark the buffer pages dirty. With Direct I/O, the NVMe device DMA-writes data directly into the pages backing the user-space buffer. Those pages must then be marked dirty so that the VM does not treat them as clean pages.folio_*: It updates VM state associated with the folio, including its reference count, dirty state, mapping, locking, and reclaim-related state. In the Linux VM, a folio is a unified abstraction for a physically contiguous set of pages.
In a word, the wide frame of io_submit_sqes represents the cumulative cost of preparing user memory for Direct I/O DMA. Each SQE contains only a user-space pointer and length. The kernel must walk the page tables, find and pin the backing struct pages, build bio_vec entries, update folio state, and submit the resulting bio.
Most of that work is paid per page. A 1 MiB read backed by 4 KiB pages touches roughly 256 pages, turning one logical read into hundreds of page-table lookups, page pins, folio updates, and bio-vector operations. At 20,000 to 50,000 reads per second, the system processes roughly 5 to 13 million pages through GUP (Get User Pages) per second. If the virtual address range is backed by heavily fragmented physical memory, there may be a comparable number of folio metadata updates and atomic refcount/pincount updates, along with potential cross-core cache-line ownership transfers.
Therefore, if we can avoid paying the cost of processing the user-space buffer on every I/O, we should be able to improve performance. Fortunately, liburing provides a way to do exactly that. io_uring_register_buffers(3) lets us register I/O buffers ahead of time, moving this metadata preparation work out of the per-I/O path. More specifically, io_uring_register_buffers(3) performs the following work up front:
- Validates the
iovecsup front, checking address ranges, lengths, alignment, and count limits. - Performs GUP on the buffers, translates the user-space virtual addresses into the corresponding struct pages / folios, and pins those pages for the lifetime of the registration.
- Constructs and retains kernel-side buffer metadata, building
io_mapped_ubuffor each registered buffer.
These are exactly the major costs we just observed in the flamegraph! Let’s try it. In the demo, we introduce a 64 MiB read arena and divide it into 1 MiB slots, matching the I/O size. At startup, we register the 64-slot read arena as 64 io_uring fixed buffers through io_uring_register_buffers(3), with one iovec per slot. For each read, we switch the opcode from opcode::Read to opcode::ReadFixed and set buf_index to the corresponding slot. This allows the I/O path to use registered buffers. Here are the results:
| inflight | GiB/s | avg µs | p50 µs | p90 µs | p99 µs | p99.9 µs |
|---|---|---|---|---|---|---|
| 4 | 9.09 | 429 | 421 | 519 | 641 | 767 |
| 8 | 16.78 | 465 | 447 | 590 | 775 | 966 |
| 16 | 28.08 | 556 | 514 | 774 | 1119 | 1425 |
| 32 | 39.87 | 783 | 705 | 1229 | 1754 | 2184 |
| 64 | 46.00 | 1358 | 1248 | 2089 | 3195 | 4214 |
As the I/O depth increases, throughput continues to rise. At an I/O depth of 64, it nearly saturates the NIC bandwidth.
| inflight | Baseline GiB/s | READ_FIXED GiB/s | Δ | Baseline p99 µs | READ_FIXED p99 µs |
|---|---|---|---|---|---|
| 4 | 8.87 | 9.09 | +2% | 632 | 641 |
| 8 | 15.56 | 16.78 | +8% | 784 | 775 |
| 16 | 22.69 | 28.08 | +24% | 1118 | 1119 |
| 32 | 22.53 | 39.87 | +77% | 1934 | 1754 |
| 64 | 22.15 | 46.00 | +108% | 3366 | 3195 |
Compared with the baseline, throughput is similar at low I/O depths, where the CPU has not yet become the bottleneck. By an I/O depth of 16, the baseline is already showing CPU pressure; beyond that point, per-I/O buffer handling becomes fully CPU-bound. READ_FIXED removes this bottleneck, allowing throughput to continue scaling until it saturates the NIC.
The flame graph also confirms this.

2. Scale to a Larger Deployment #
With the simple demo resolved, we can move on to a larger-scale demo that more closely reflects a real-world deployment.
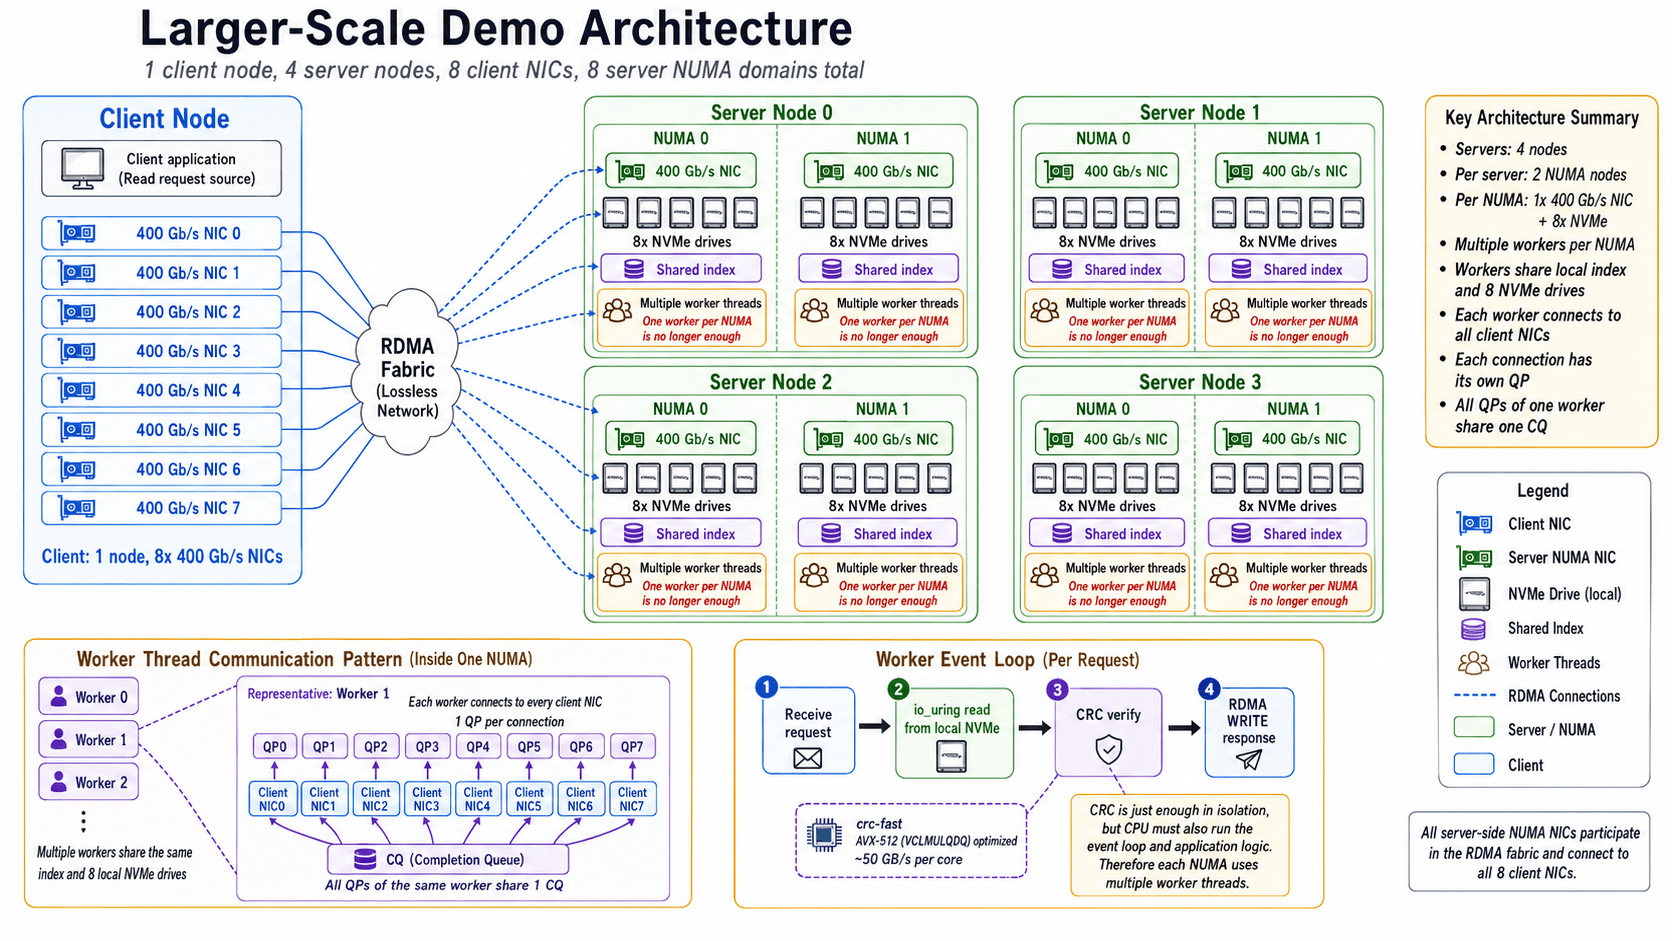
In the larger-scale demo, the client consists of a single node equipped with 8 * 400 Gb/s NICs. The server side consists of 4 nodes. Each server has 2 * NUMA nodes, and each NUMA node has 1 * 400 Gb/s NIC and 8 * the same NVMe drives used in the previous demo.
The I/O size increases from 1 MiB to 1,028 KiB because an additional 4 KiB is needed to store metadata.
The event loop is similar to the earlier version, but to better approximate a real workload, the server verifies the CRC of each read before sending it back via RDMA WRITE. For CRC computation, it uses crate crc-fast, which includes an implementation optimized with AVX-512 VPCLMULQDQ instructions. It can deliver roughly 50 GiB/s of checksum throughput on a single core.
While the CRC computation throughput is just enough for this workload in isolation, a CPU core must also run the event loop and handle other application logic. One worker thread per NUMA node is therefore no longer sufficient. Instead, each NUMA node is served by multiple worker threads that share the same index and the eight local NVMe drives. The index is sharded as well, preventing a global index lock from becoming a performance bottleneck.
Each worker thread connects to every NIC on the client node. Each connection has its own QP, while all QPs owned by the same worker share a single CQ for completion processing.
To make the discussion below clearer, I will use the following terms for the different levels of sharding on the server side:
| Term | Explanation |
|---|---|
| Cluster | The four-node deployment. |
| Node | A physical server. Each node contains two NUMA nodes, with a total of two 400 Gb/s NICs and sixteen NVMe drives. |
| Shard | 1 * NUMA node within a physical server. Each shard owns 1 * 400 Gb/s NIC and 8 * NVMe drives, and is served by multiple worker threads. |
| Worker thread | A CPU-pinned worker thread. Worker threads within the same shard share the NIC, index, and local NVMe drives. Each worker thread connects to every client NIC through a dedicated QP per connection, while sharing a single CQ across all of its QPs. |
Now that we have a clear picture of the larger-scale demo (hopefully), let’s put it under load! Here are the results; T represents the worker thread count per shard, and all throughput numbers are in GiB/s.
| Config | iodepth=16 | iodepth=32 | iodepth=64 |
|---|---|---|---|
| T=4 | 181.9 | 204.9 | 209.2 |
| T=8 | 183.2 | 207.1 | 209.8 |
| T=16 | 181.4 | 206.0 | 211.2 |
In theory, the system should be able to reach an aggregate throughput of 372.5 GiB/s across all 8 * NICs. In practice, however, we achieved only about half of that throughput.
Here comes a new bottleneck!
Next, let’s work through the flame graph step by step to identify the bottleneck.
2.1 Ruling Out the Impact of iou-wrk
#
To locate the bottleneck, let’s look at the new flamegraph, captured from a T=8 run with an I/O depth of 64.
Tips: The full flamegraph is too large to embed here. You can download the SVG and open it directly in a browser to explore the details.

Although the multi-shard flame graph is fairly complex, it splits quite clearly into two clusters: 16 iou-wrk threads on the left and 16 worker threads on the right.
When we captured the flame graph for the simple demo, there was only a single worker thread, so we profiled only that thread and did not include the iou-wrk threads. And because the simple demo was already able to saturate the NIC, this also made it easy to overlook the impact of iou-wrk.
Could this bottleneck be caused by iou-wrk overhead? To answer that, let’s first look at where the iou-wrk threads come from.
iou-wrk is a kernel worker thread that io_uring uses when the submitting thread cannot complete an I/O request immediately. It continues the request asynchronously through the kernel submission or potentially blocking path.
Then why are our reads being offloaded to iou-wrk?
The larger-scale demo inherits the simple demo’s read-arena design: buffers are registered with io_uring, and reads use READ_FIXED. This avoids per-I/O page-table walks and page pinning, but the underlying physical memory is still backed by scattered 4 KiB pages. When building the bio and request, if the 257 * 4 KiB pages backing a 1,028 KiB buffer have non-contiguous PFNs, they cannot be merged into larger physically contiguous ranges. From the block layer’s and DMA engine’s perspective, the I/O is therefore represented as roughly 257 scatter-gather segments. However, hardware and system limits prevent all 257 segments from being submitted in a single bio. The following parameters can cause a bio to be split:
| Parameter | Meaning | What it affects |
|---|---|---|
max_segments | The maximum number of scatter-gather segments allowed in a single block request. A segment usually represents a physically contiguous memory range. | If the buffer is too fragmented and exceeds this limit, the bio/request is split. |
max_segment_size | The maximum size, in bytes, of a single segment. | Even when the segment count is within the limit, an individual physically contiguous range may still be constrained by this maximum size. |
max_sectors_kb | The maximum request size currently allowed by the block layer, in KiB. It is usually configurable, but cannot exceed the hardware limit. | An I/O larger than this value is split into multiple requests. |
max_hw_sectors_kb | The maximum request size supported by the device or driver, in KiB. | This is the upper bound for max_sectors_kb; users generally cannot raise max_sectors_kb beyond it. |
nr_requests | The number of requests that a blk-mq software queue may hold. | It affects queue depth and queueing capacity. It does not determine whether an individual I/O is split, but a shallow queue can limit concurrency. |
On the server, these parameters are configured as follows:
> dev=nvme0n1
> for f in \
  max_segments \
  max_segment_size \
  max_sectors_kb \
  max_hw_sectors_kb \
  nr_requests
do
  printf "%-24s " "$f"
  cat "/sys/block/$dev/queue/$f"
done

max_segments             128
max_segment_size         4294967295
max_sectors_kb           1280
max_hw_sectors_kb        4096
nr_requests 1023Because 257 divided by 128 leaves a remainder of 1, each 1,028 KiB request is split into three bios: the first two contain 128 segments each (512 KiB), and the last contains a single 4 KiB segment. This gives an average bio size of 342.67 KiB. We can confirm this with iostat’s rareq-sz metric:
> iostat -x -d /dev/nvme0n1
Device  ... rareq-sz ...
nvme0n1 ... 342.65 ...Therefore, the trigger chain for a 1,028 KiB request is roughly as follows:
1,028 KiB buffer without hugepages
  → 257 physical 4 KiB segments
  → exceeds `max_segments = 128`
  → enters the multi-bio / split path
  → `io_uring` first submits with `NOWAIT`
  → the block Direct I/O path finds that the iterator still has data left to process and cannot continue inline
  → returns `-EAGAIN`
  → `io_uring` calls `io_queue_async` / `io_queue_iowq`
→ `iou-wrk` takes overAt this point, we have identified what triggers iou-wrk. The next question is whether iou-wrk is actually the bottleneck preventing throughput from scaling further.
Unfortunately, the answer here is NO. A few additional experiments allow us to rule it out. While running the larger-scale demo, I also ran a separate experiment with CRC disabled. The results are shown below, in GiB/s.
| Config | iodepth=16 | iodepth=32 | iodepth=64 |
|---|---|---|---|
| T=16, CRC=on | 181.4 | 206.0 | 211.2 |
| T=16, CRC=off | 218.6 | 290.5 | 305.5 |
As shown, disabling CRC improves performance substantially, even though bio splitting and iou-wrk are still present. The simple demo points to the same conclusion: it reached NIC saturation easily without accounting for iou-wrk overhead at all.
Several additional observations support this conclusion.
I traced the handoff from io_uring_queue_async_work to io_wq_submit_work and found that queueing delays were only on the order of a few microseconds:
| Run | Average io-wq queue wait |
|---|---|
| CRC=on, T=8 | 8.30 µs |
| CRC=off, T=8 | 8.22 µs |
Applying Little’s Law to the io-wq queue,
Lq = λ × Wqgives an average queue depth below 1. In other words, on average, not even one disk read is waiting in the io-wq queue. This is strong counterevidence: if an iou-wrk backlog were the throughput wall, the queue could not remain this shallow.
The worker pool is not short on threads either. Under saturation, the system creates many transient iou-wrk threads, but almost none of them are actually runnable:
| Run | Average concurrent iou-wrk threads | Average runnable iou-wrk threads |
|---|---|---|
| CRC=on, T=8, inflight=64 | 145 | 0.90 |
| CRC=on, T=16, inflight=256 | 107 | 0.74 |
So this is not a case of exhausting the worker pool. The disk queues are not saturated either: per-disk aqu-sz is around 3, while nr_requests is 1023.
Finally, to isolate the split operation itself, we ran one more control by lowering only the block queue’s max_sectors_kb.
The lower rareq-sz value confirms that requests are being split more aggressively, from 342.67 KiB to 205.60 KiB. So the control really did increase the split count from 3 requests/GET to 5 requests/GET. But throughput did not move:
| CRC=on, T=16, inflight=64 | max_sectors_kb | rareq-sz | requests / GET | aggregate throughput |
|---|---|---|---|---|
| default | 1280 | 342.67 KiB | 3.00 | 211.2 GiB/s |
| forced more splits | 256 | 205.60 KiB | 5.00 | 211.2 GiB/s |
This rules out request splitting itself, per-split CPU overhead, and the async-versus-inline transition as sufficient explanations for the throughput gap. They are all real effects, but none of them is the wall on its own.
2.2 Ruling Out the Impact of fget
#
In the per-shard flame graphs for both the simple demo and the large demo, we found another major source of overhead in io_uring_enter, with fget accounting for most of its cost. Take shard 48 from one run of the large demo as an example.

fget can come from two places: looking up the target file descriptor for disk SQEs (once per actual disk I/O), and looking up the ring file descriptor itself on every io_uring_enter call. Could fget be the source of the performance bottleneck?
Similar to READ_FIXED, io_uring provides mechanisms to eliminate both sources of overhead: registered files remove the fd lookup on the disk-I/O path, while a registered ring fd removes the lookup of the ring fd itself on every io_uring_enter call. Together, they eliminate both categories of fget.

From the flame graph, we can confirm that fget overhead is now almost entirely gone. However, the bottleneck still remains. The throughput numbers below are in GiB/s.
| Config | inf=16 | inf=32 | inf=64 |
|---|---|---|---|
| T=8 | 183.2 | 207.1 | 209.8 |
| T=8, regfiles=on, regring=on | 180.6 | 206.6 | 210.2 |
This shows that fget is not the source of the performance bottleneck. The flame graph also reveals that, although fget has disappeared, the cost of io_uring_enter remains. Why?
That remaining cost comes from our busy-polling loop: when no I/O has completed and the CPU is otherwise idle, the io_uring poll path simply spins. This is also indirect evidence that the current bottleneck is not CPU-bound.
2.3 Ruling Out the Impact of CRC Computation #
Although Section 2.2 is already sufficient to show that the bottleneck is not CPU-bound, we still rule out CRC computation as a possible source of contention, just to be safe. Because disabling CRC in an earlier experiment allowed performance to break through the bottleneck.
This time, we test the hypothesis more thoroughly under three configurations:
- CRC enabled
- CRC disabled
- CRC disabled, but with the read buffer touched at a 64 B stride after each read
Here touch=on means a cache-line-granular scan: after each read, the worker performs one load every 64 B across the 1,028 KiB buffer, without doing CRC arithmetic.
| Config | agg GiB/s |
|---|---|
| T=16, CRC=on | 208.6 |
| T=16, CRC=off | 305.9 |
| T=16, CRC=off, touch=on | 209.3 |
Something surprising happens: when we disable CRC entirely, performance breaks through the bottleneck. But when we disable the CRC computation while performing only one load every 64 B across the read buffer, performance hits the bottleneck again!
This is enough to show that CRC computation itself is not the source of the bottleneck. More importantly, we seem to have identified the key operation that reproduces it.
3. The Real Bottleneck: TLB Misses #
In Section 2.3, we observed an interesting phenomenon: as long as we touch the buffer at a 64 B stride after the read, even without performing any computation, the system still hit the bottleneck. Looking back at the experiments in Chapter 1 and Section 2.1, we repeatedly encountered issues caused by 4 KiB pages. Could the bottleneck here be neither compute-bound nor I/O-bound, but instead caused by stalls in 4 KiB-page address translation?
To test this hypothesis, we replace the 64 MiB read arena backed by 4 KiB pages with a 1 GiB hugepage-backed read arena and compare the results. The throughput numbers below are in GiB/s.
| Config | inf=16 | inf=32 | inf=64 |
|---|---|---|---|
| T=8, CRC=on, hugepage=off | 183.2 | 207.1 | 209.8 |
| T=8, CRC=off, hugepage=off | 220.3 | 291.9 | 306.3 |
| T=8, CRC=off, hugepage=on | 229.8 | 309.3 | 355.3 |
| T=8, CRC=on, hugepage=on | 209.7 | 298.4 | 350.7 |
| T=16, CRC=on, hugepage=off | 181.4 | 206.0 | 211.2 |
| T=16, CRC=on, hugepage=on | 210.1 | 298.0 | 347.6 |
The results show that, with hugepages enabled, we can nearly saturate the NIC at T=8 even with CRC enabled.
This is sufficient to confirm that hugepages are an effective remedy for the bottleneck. It also validates that the three factors we ruled out in Chapter 2 are not the root cause.
However, although we have eliminated the bottleneck, we still cannot conclusively show that it was caused by address translation. We still need hard evidence to prove it. Therefore, I reran the experiment and used perf stat to measure CPU L1D misses and dTLB misses.
| state | aggregate GiB/s | L1D load misses / GET | dTLB load misses / GET | 4 KiB page-walk reloads / GET |
|---|---|---|---|---|
| HP=off, CRC=off, touch=off | 306.1 | 2045.0 | 6.7 | 3.6 |
| HP=off, CRC=off, touch=on | 210.3 | 18472.7 | 88.5 | 78.7 |
| HP=off, CRC=on, touch=off | 209.7 | 19214.5 | 81.0 | 66.0 |
| HP=on, CRC=off, touch=on | 350.2 | 17005.4 | 5.1 | 2.9 |
The results make the picture clear. With 4 KiB pages, both the CRC-enabled run and the CRC-disabled run with a 64 B-stride scan across the read buffer incur more than 80 dTLB misses per GET on average. Once hugepages are enabled, the dTLB-miss count drops to the same level as in the fully CRC-disabled case. This provides direct evidence that dTLB misses are the root cause of the throughput bottleneck.
By contrast, higher L1D-miss counts do not correlate with lower throughput in any of the tested configurations. That also rules out L1D misses as the bottleneck.
Why do TLB misses cause such a large performance regression?
A TLB is the CPU’s address-translation cache: it stores recent virtual-to-physical page translations. Before the CPU can load from or store to memory, it must determine which physical page backs the virtual address. A TLB hit is fast; on a miss, the CPU must walk the page tables.
TLB misses matter because they stall execution before the actual data access can proceed. Translating an address in a 4 KiB page may require a multi-level page-table walk through entries such as PGD, PUD, PMD, and PTE. Those page-table entries must themselves be fetched from cache or memory, and can in turn incur cache misses.
For a path that streams through a 1,028 KiB value, the CPU reads cache lines while repeatedly crossing 4 KiB page boundaries. A 1,028 KiB value spans 257 * 4 KiB pages. Once the active translations no longer fit in the dTLB, the CPU repeatedly performs page walks, directly reducing throughput.
Hugepages help because they increase the granularity of address translation. With 4 KiB pages, a 1,028 KiB value requires 257 page translations. With 1 GiB hugepages, the same 1,028 KiB region is typically covered by a single large-page translation. A small number of TLB entries can therefore cover far more data, substantially reducing dTLB misses and 4 KiB page-walk reloads.
At this point, the story finally lines up end to end. READ_FIXED removed the repeated kernel-side cost of discovering and pinning user pages, but it did not change what the CPU had to pay when the application later scanned the data. With 4 KiB pages, every 1,028 KiB value still forced the CPU to cross hundreds of page translations; CRC merely made that scan explicit, while touch=on reproduced the same pressure without doing any checksum work. Hugepages fixed the missing piece by making the data path translation-friendly as well. The bottleneck was not in the disks, the NIC, io_uring offload, fd lookup, or CRC arithmetic. It was the cost of translating the memory that all of those components were moving through.
X. “A Planet Upside Down” #
In fact, when I first used AI to debug this performance bottleneck, its earliest suggestion was to optimize the read arena with hugepages—and that was enough to saturate the NIC. However, it did not identify the real underlying cause: TLB misses. Instead, it kept circling around the various issues we had already uncovered.
For an engineer with experience in HPC and storage performance optimization, the nature of the problem may be recognizable from experience. But because the debugging trace left behind was probably too sparse, the AI did not have enough evidence to reconstruct that reasoning. It could produce the answer, but not the full chain of reasoning that leads to it.
I think that may be one of the reasons this blog post is worth writing.
To be honest, my work should have been done as soon as the AI finished the initial performance optimization. Ironically, figuring out why the optimization worked ended up taking far more of my own time than the original task itself. As AI models become more capable, they can build surprisingly good systems even without a real understanding of the underlying principles.
But digging into those principles has always been one of my small obsessions as a programmer. In the flood of AI, it may also be one of the ways I keep myself from slipping into a sense of meaninglessness.
To close, I want to share a few lines from a song I’ve been listening to lately. A toast to everyone still trying to stay grounded in this era.
You used to wonder why,
but now you wonder how.
…
But you’re still trying hard to understand,
to comprehend,
to wrap your head around
all the things that don’t make sense,
that don’t mix in
a planet upside down.
— A Planet Upside Down (Pearl & The Oysters)